


Denounce with righteous indignation and dislike men who are beguiled and demoralized by the charms pleasure moment so blinded desire that they cannot foresee the pain and trouble.
Read More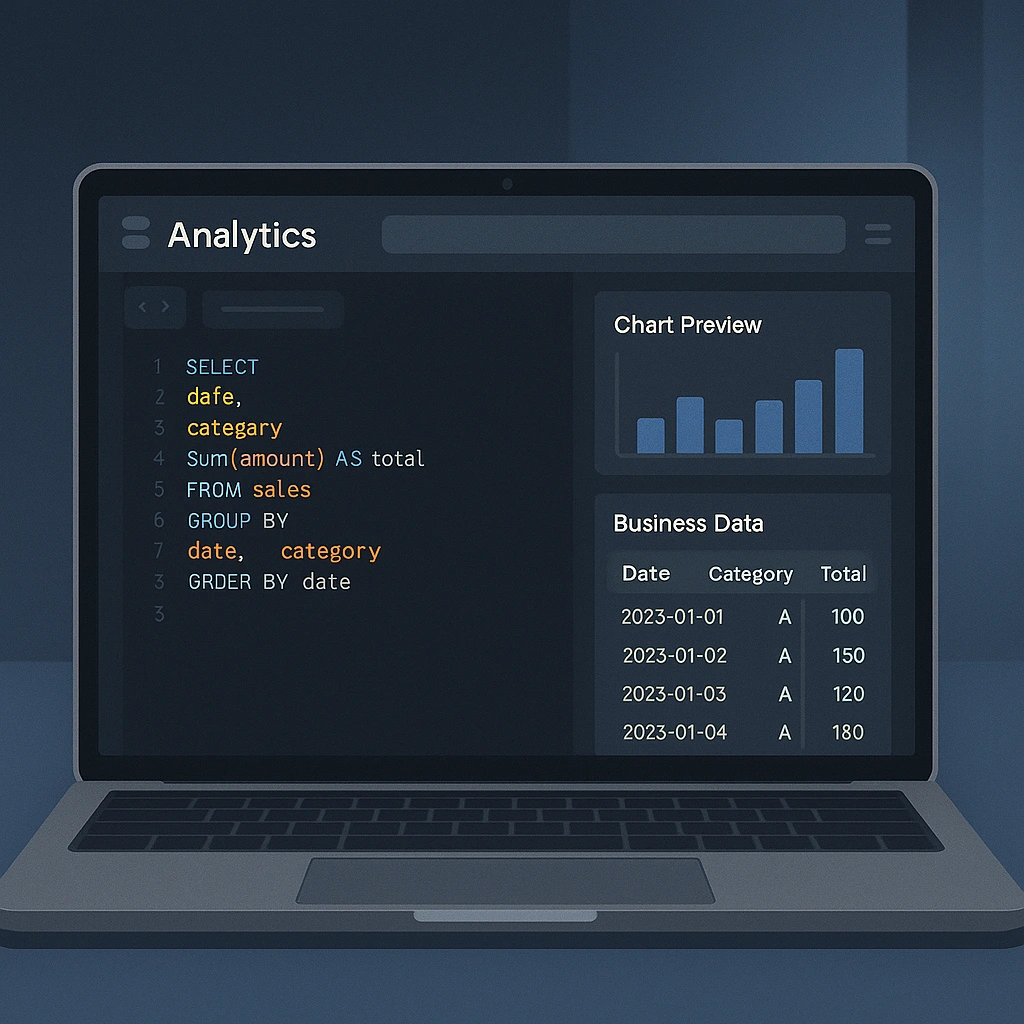
🔍 Web-Based Exploration Workspace
A Smart SQL Editor Without the Jargon Even for users who don’t speak SQL fluently, this interface provides an intuitive way to explore datasets, filter results, and discover correlations. For data-savvy professionals, the platform offers a web-based query editor to craft precise queries and extract nuanced insights.
- No installations required
- Access anywhere, anytime
- Real-time query previews and smart suggestions
- Seamless dataset preparation for dashboards
This turns business users into empowered explorers—no more waiting days for IT to run a simple filter.

📊 Interactive Dashboards & Real-Time Visualizations
Turn rows of raw data into compelling visuals—without needing a background in data science. With an extensive library of over 40 visualization types, users can create:
- Trend lines that tell a story
- Geo-visuals that show performance by region
- Bar, pie, and funnel charts for executive summaries
Visuals are interactive, drillable, and shareable—perfect for meetings, reports, or spontaneous strategic reviews.
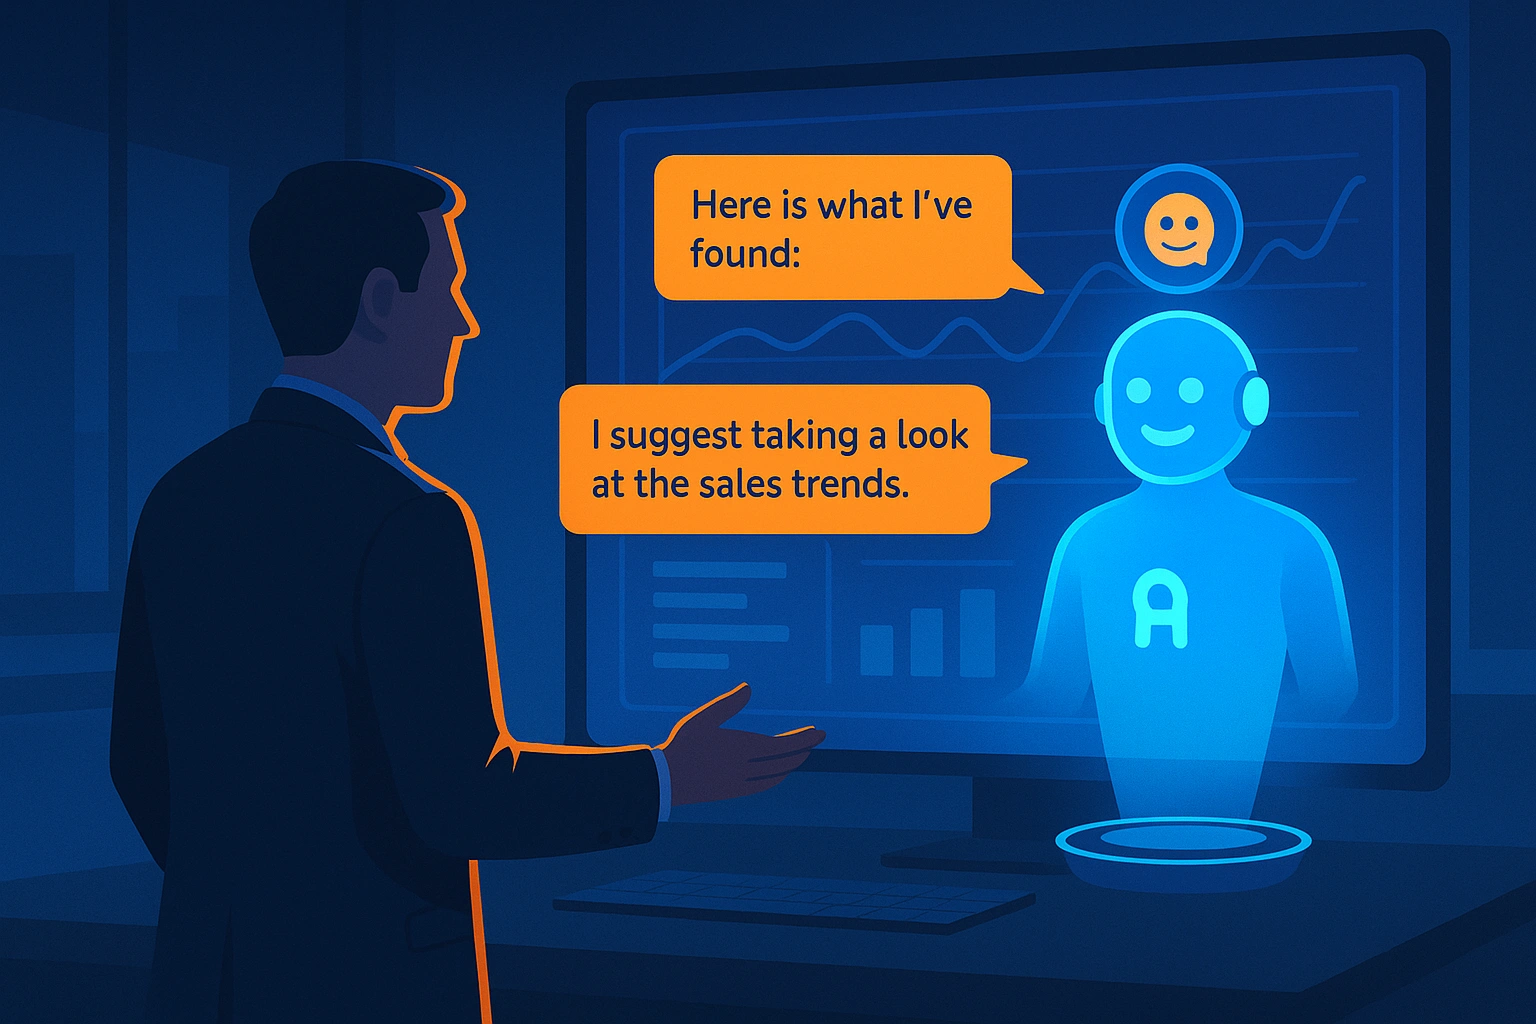
🧠 AI-Enhanced Engagement via Conversational Assistant
Navigating analytics can be daunting. That’s why this platform integrates seamlessly with an AI-powered assistant—an intelligent guide that:
- Helps interpret dashboards in plain language
- Offers suggestions for additional data slices
- Can be embedded into websites or portals for external users
- Acts as an always-on data concierge for business teams
The result? More questions answered. More teams enabled. More time for strategy.
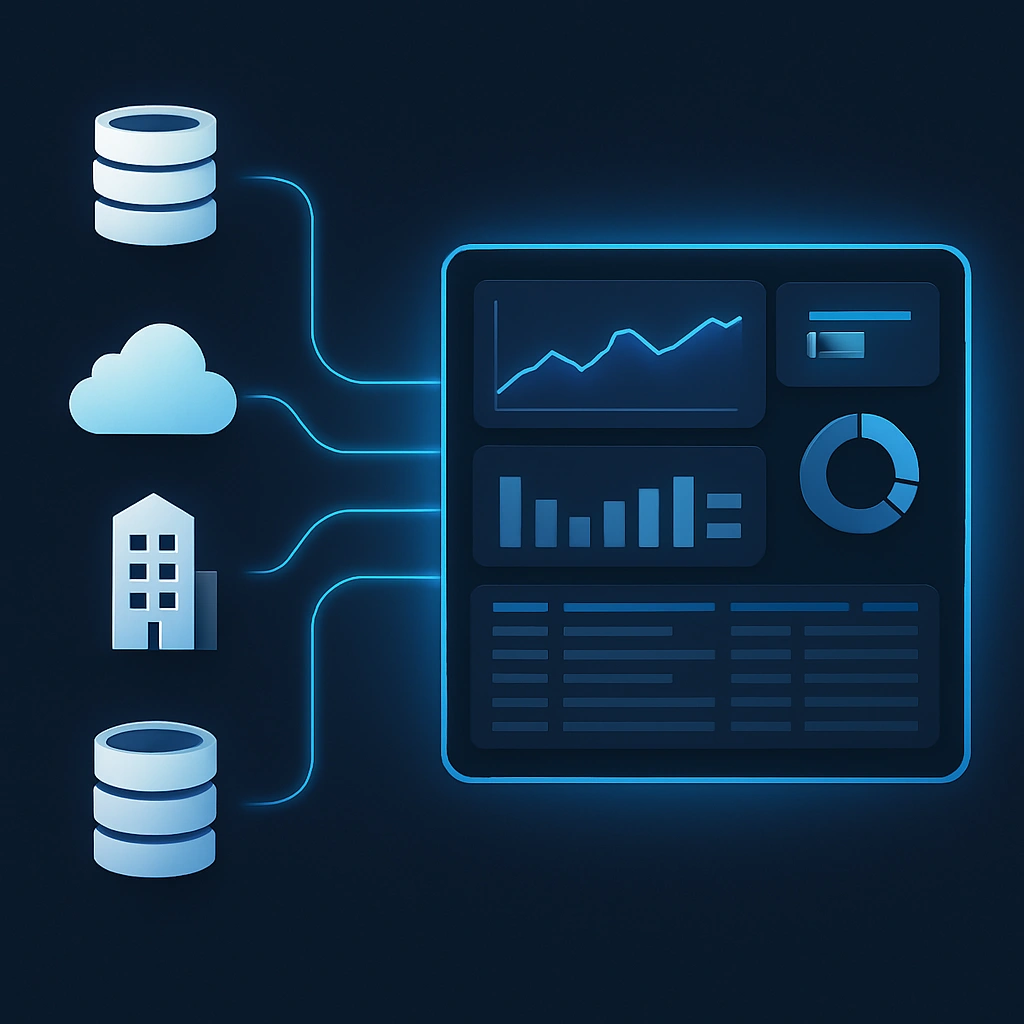
🔌 Seamless Connectivity to All Your Data Sources
Whether your data lives in cloud databases, data warehouses, or legacy systems, this platform speaks the language of your entire data ecosystem. It connects natively with your structured data sources and allows unified querying from a single interface.
No more copying spreadsheets between tools. No more juggling credentials. Just instant access to what matters.
🎯 Key Business Outcomes
🌟 Ideal Use Cases
🔐 Built for the Enterprise
📈 The Future of Data Is Here
🎯 Key Business Outcomes

🎯 Key Business Outcomes
- ✅ Faster decision cycles — less dependency on analysts
- ✅ Deeper insights — via drill-down, filtering, and trend tracking
- ✅ Higher team alignment — shared dashboards, real-time updates
- ✅ Enhanced customer experience — with embedded, branded visualizations
- ✅ Scalable insights culture — from executives to operations
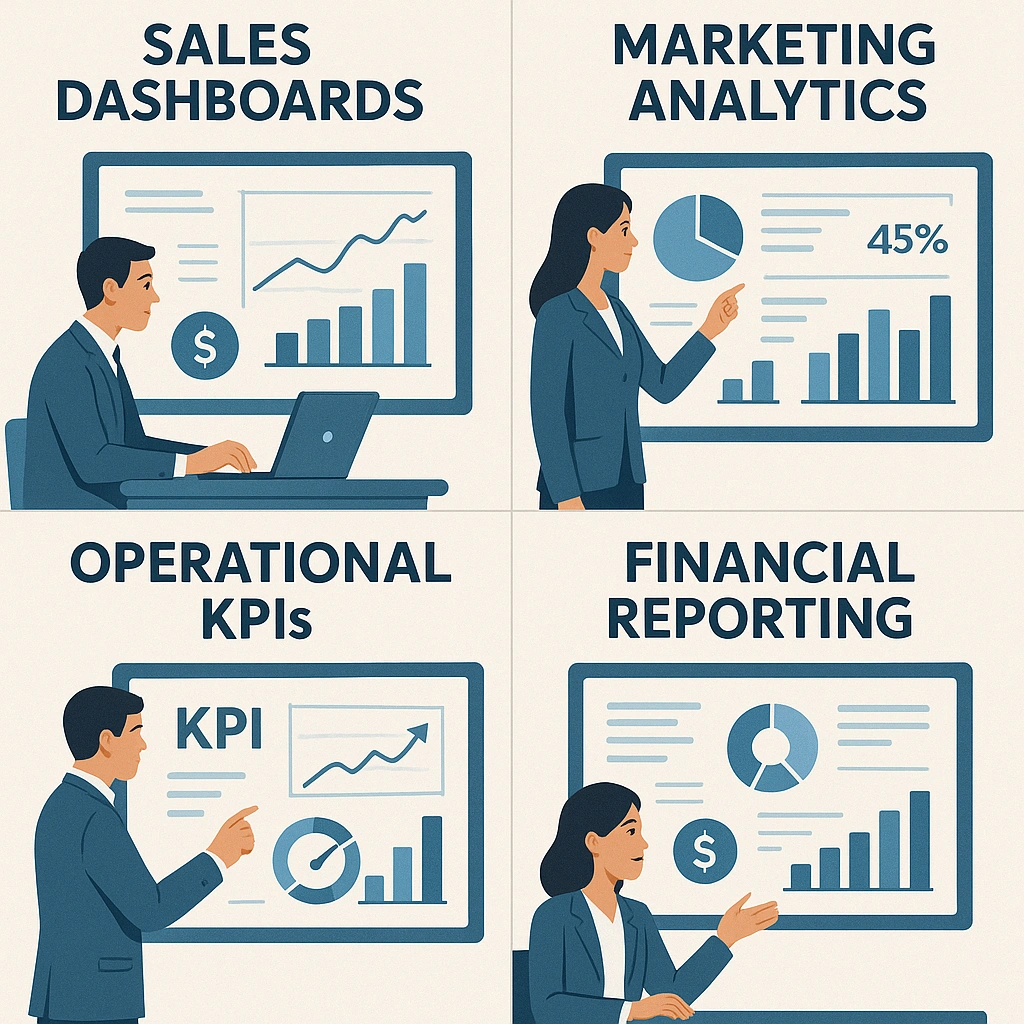
🌟 Ideal Use Cases
🌟 Ideal Use Cases
- Sales Leadership: Monitor funnel movement, territory performance, and conversion ratios
- Marketing Executives: Track campaign effectiveness, channel ROI, and engagement heatmaps
- Operations Teams: Visualize bottlenecks, inventory levels, and on-time metrics
- Finance Teams: Create up-to-date financial summaries, forecasts, and spend analyses
All with zero code. Zero IT bottlenecks. Zero lag.
🔐 Built for the Enterprise
🔐 Built for the Enterprise
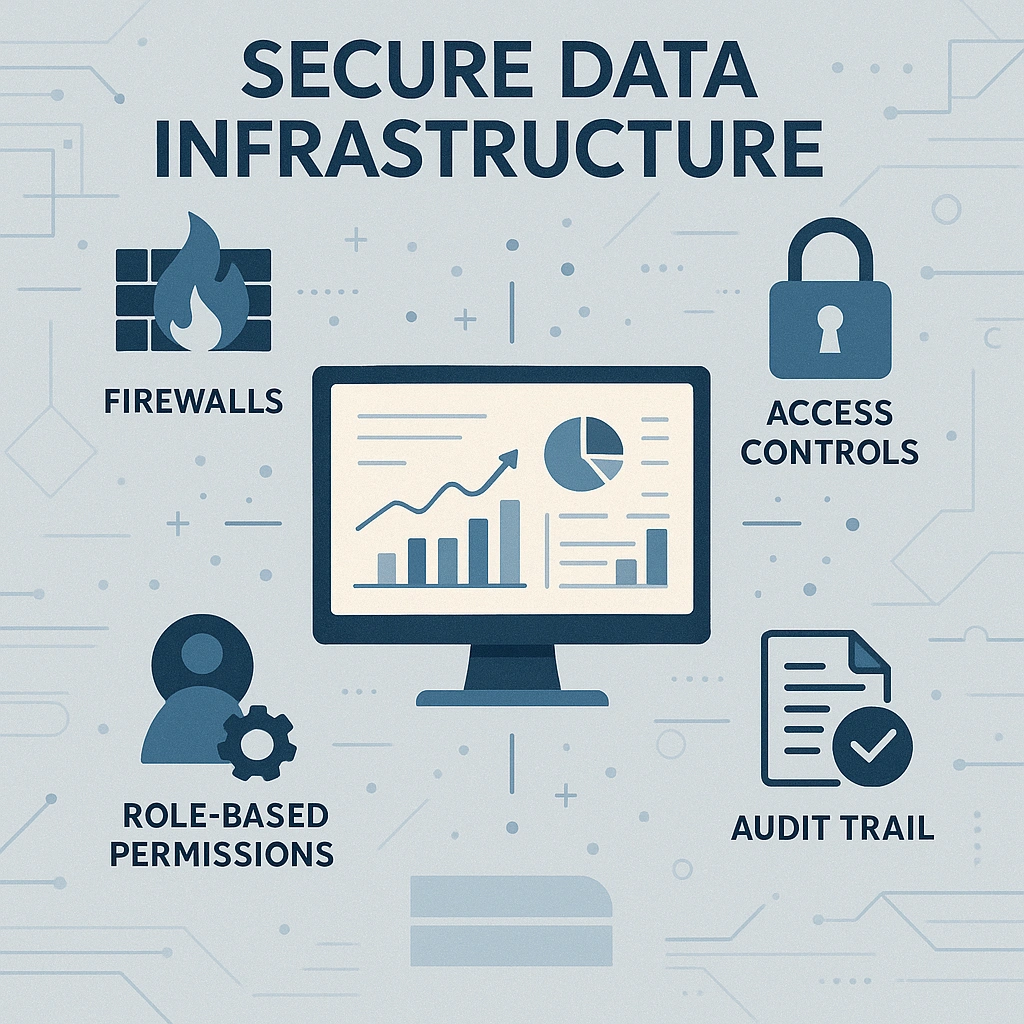
Security and governance are foundational. This solution includes:
- Audit logging for dashboard changes
- Fine-grained data-level permissions
- Scalable deployment across teams and geographies
Whether you’re a startup scaling fast or an enterprise managing complexity, the platform grows with you.
📈 The Future of Data Is Here

📈 The Future of Data Is Here
In today’s competitive landscape, being data-driven isn’t just an advantage—it’s table stakes. But becoming data empowered? That’s the real differentiator.
This data exploration platform provides the tools, interfaces, and intelligence to make every user a confident decision-maker. With visual storytelling, AI support, and real-time access, your business doesn’t just see the future—it builds it.
Empower your team. Unlock your data. Drive smarter outcomes.