NLP-Powered Dashboard: Unleashing Instant Business Insights Through Conversation
In today’s fast-paced business world, timely insights are no longer a luxury—they’re a necessity. But traditional dashboards and reporting tools often require technical expertise, time-consuming filters, and structured query language (SQL). That’s where the NLP-Based Dashboard steps in— a next-generation, AI-enabled solution that empowers every stakeholder to engage with business data simply by asking questions in everyday language.
Whether you want to track revenue growth, monitor inventory levels, or identify top-performing products, all it takes is a sentence. No coding. No spreadsheets. Just clear answers delivered in real-time, visually and intelligently.
💡 What Is the NLP-Based Dashboard?
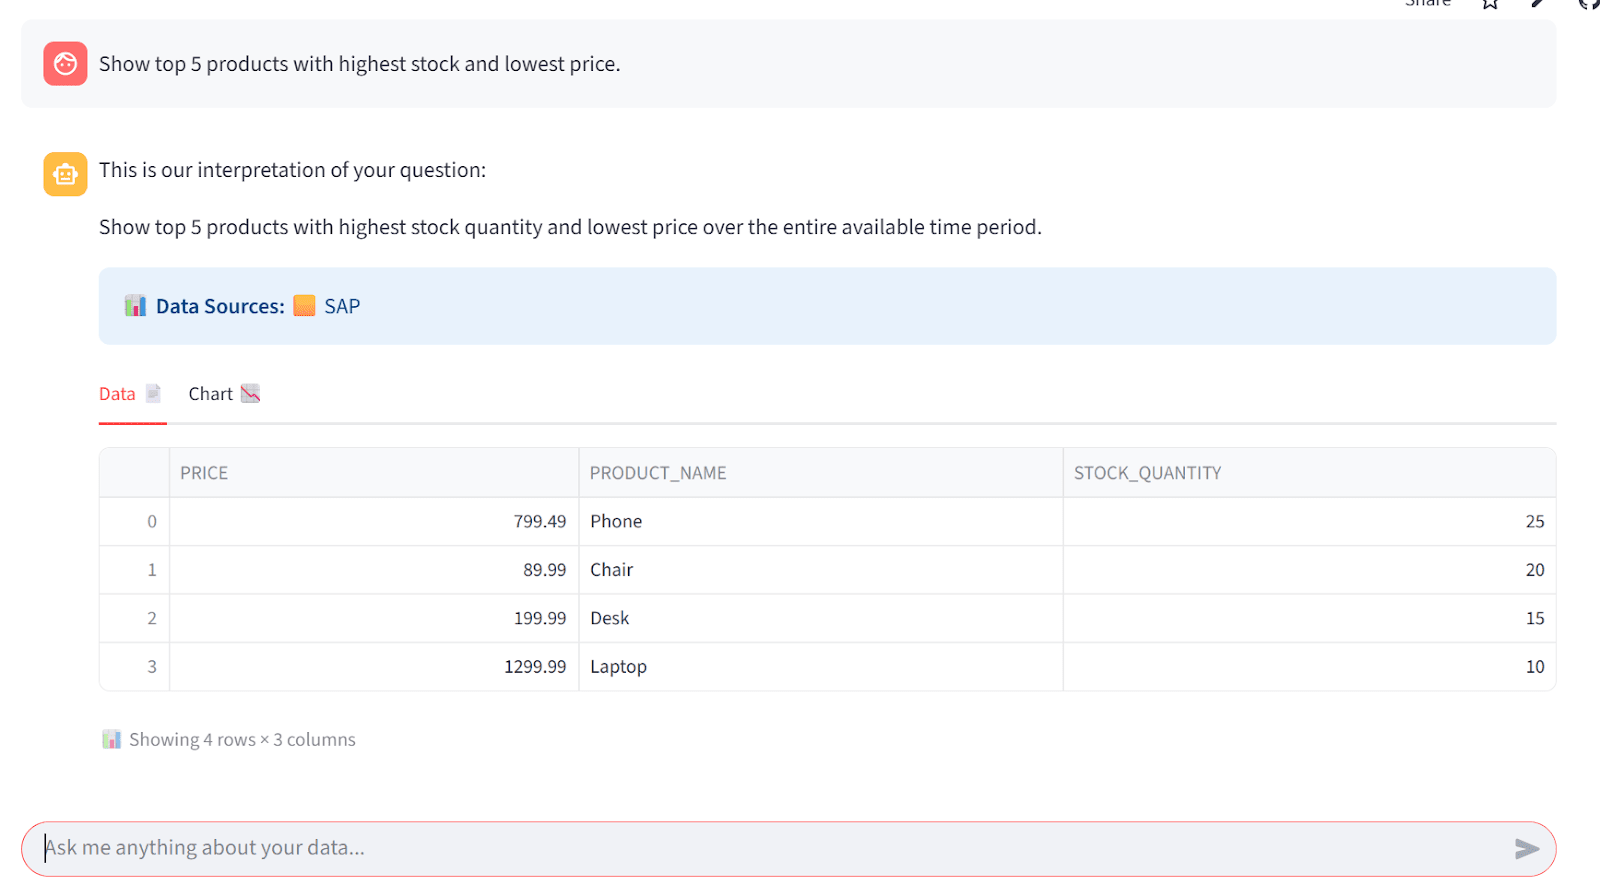
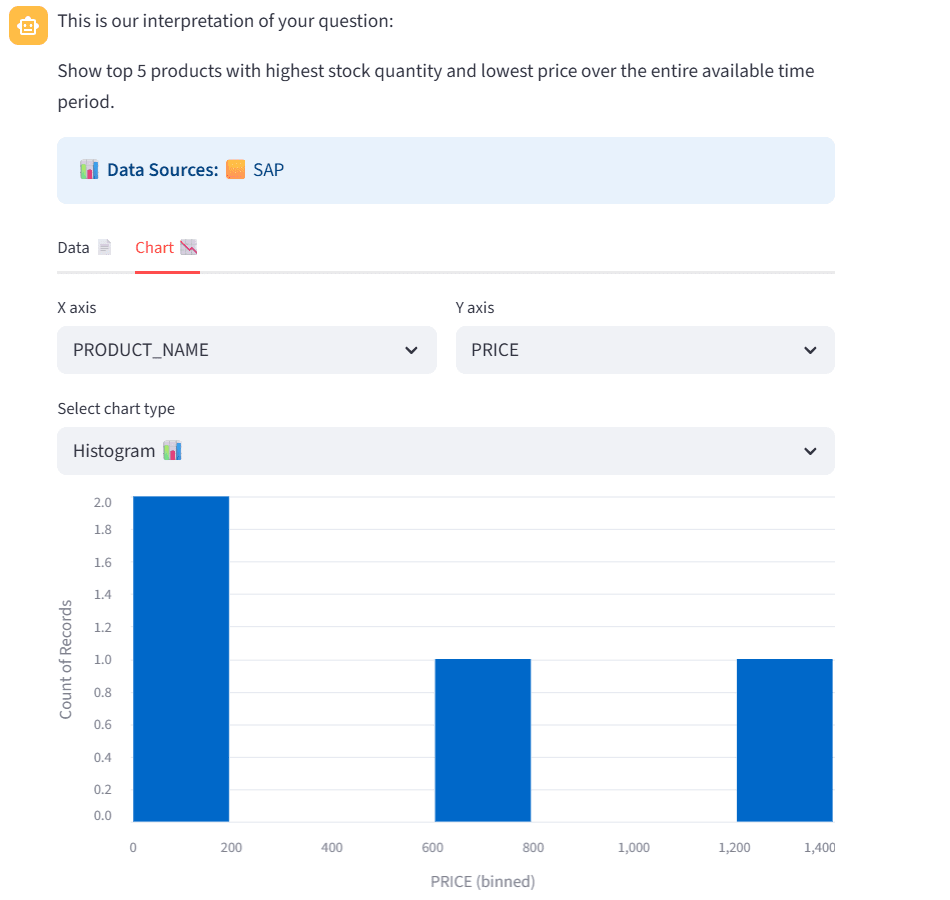
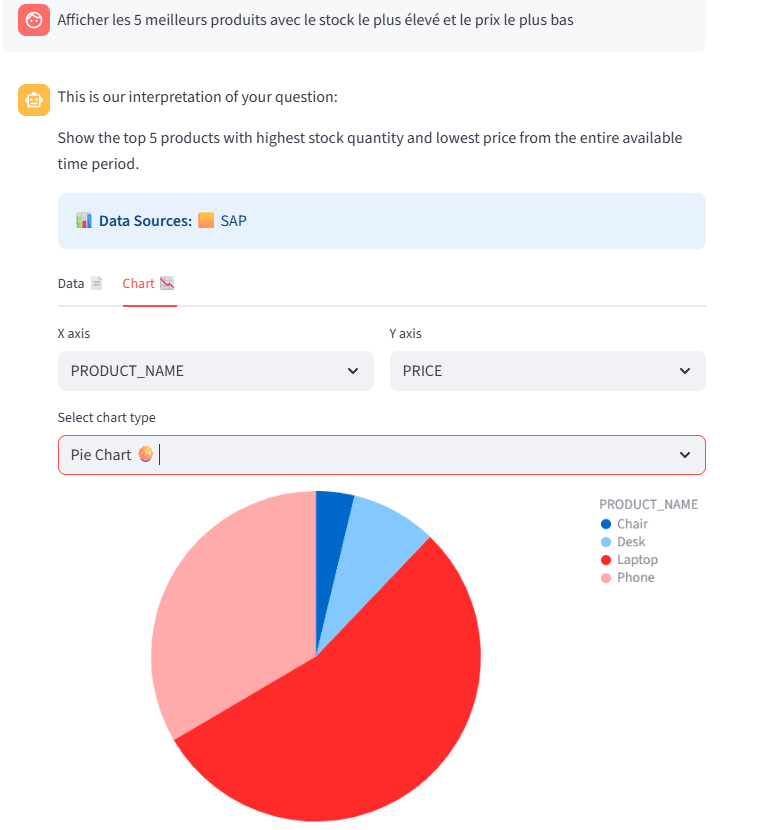
At its core, the NLP-Based Dashboard is a conversational analytics platform. It transforms how teams access and explore data by allowing them to speak or type naturally—just like asking a colleague.Imagine walking into a strategy meeting and saying, “Show me the top 5 products with the highest stock and lowest price.”
Within seconds, the dashboard responds with a table and chart, curated from live enterprise systems—ready for decision-making.
This platform removes technical barriers, accelerates decision cycles, and redefines how business interacts with data.
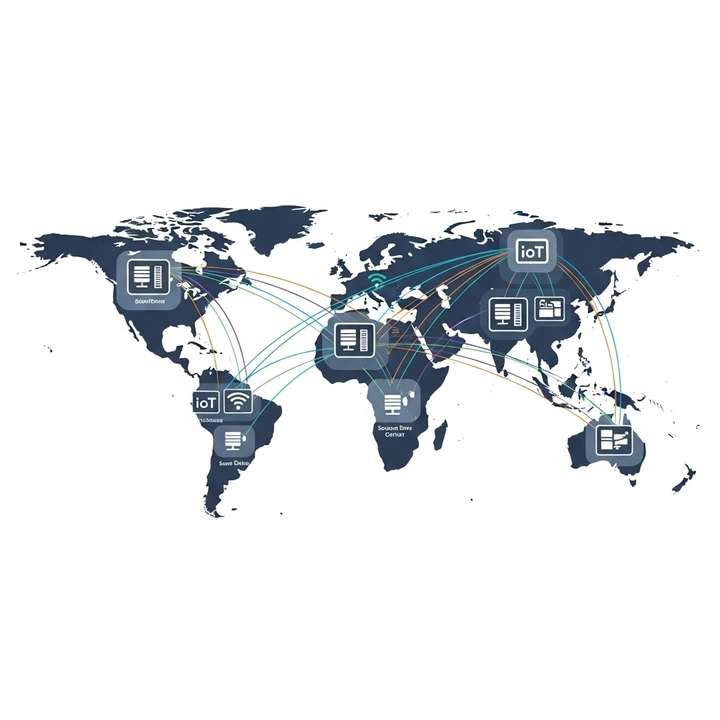
🌐 Multilingual Intelligence
Data conversations shouldn’t be limited by language. The platform supports multiple languages including English, Spanish, French, and more—enabling global teams to operate seamlessly.
🌍 Example:
Spanish: “¿Cuál es el tamaño promedio de las operaciones en el primer trimestre?”
French: “Afficher le chiffre d’affaires total de toutes les opportunités.”
This opens the door for international teams to make data-driven decisions in their native languages—no training required.

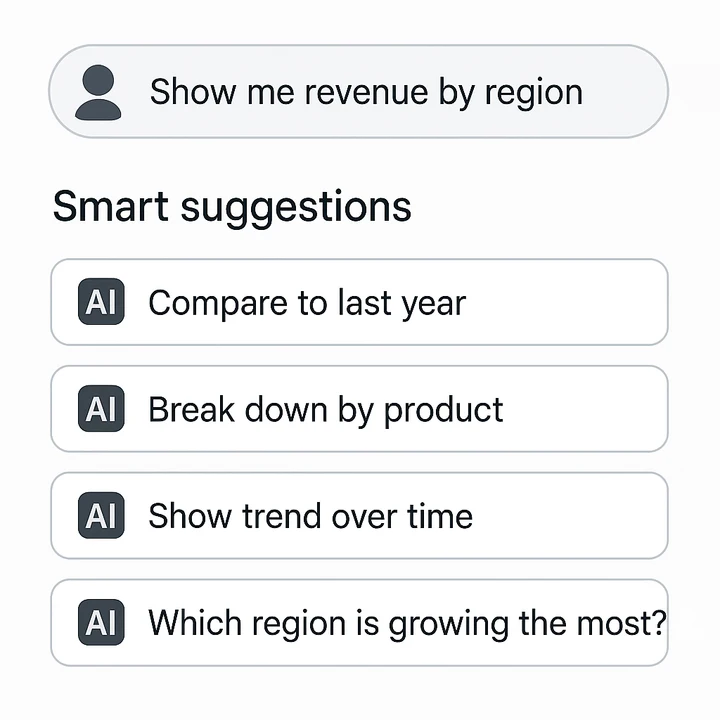
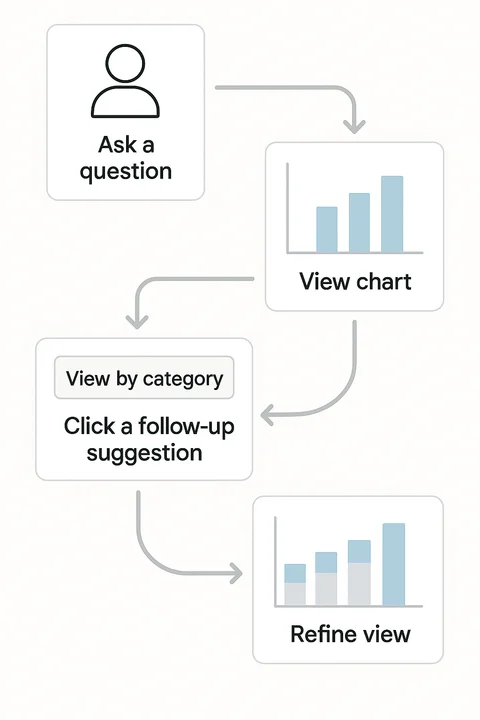
🔍 AI-Powered Smart Suggestions
Don’t know where to begin? The dashboard offers contextual follow-up questions based on your initial query. These smart suggestions enable progressive analysis—helping users go deeper without typing again.Ask:
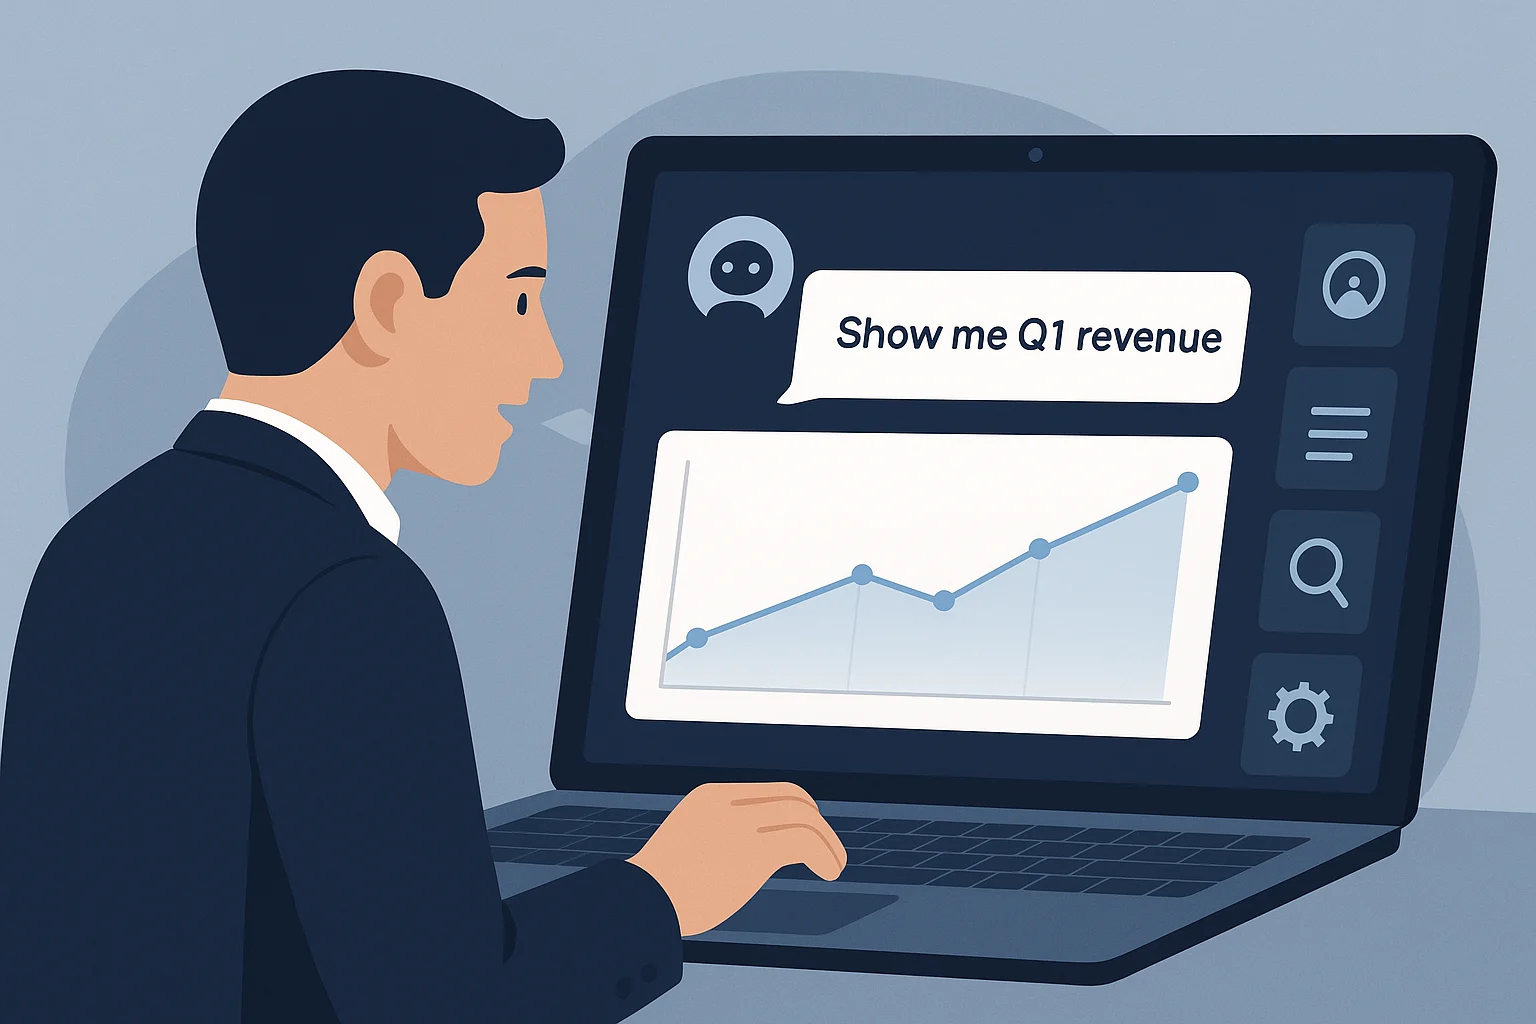
“Show me quarterly revenue.”
Suggestions:
- Break down by region
- Highlight top-performing sales reps
- Compare to previous year
This guided exploration encourages curiosity while keeping the user experience simple and fast.
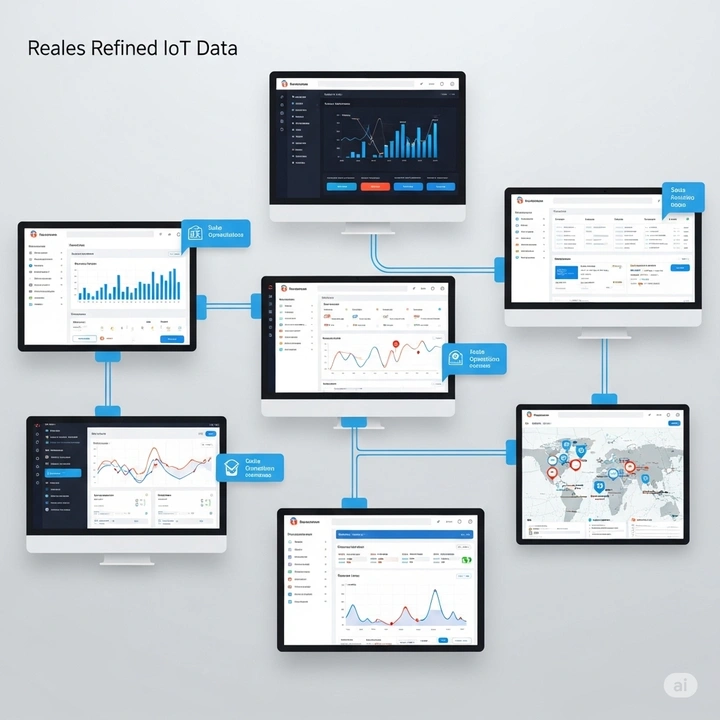
📈 Real-Time Business Analytics
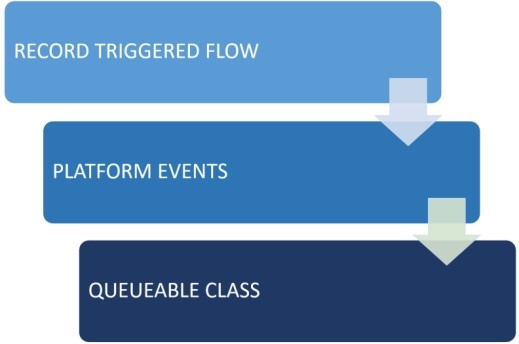
Data loses its value when it’s outdated. That’s why this platform connects to live enterprise systems—ensuring your insights reflect today’s reality, not last month’s snapshot. As new opportunities are created, inventory is updated, or revenue is recorded, the dashboard reflects those changes instantly.Tap into customer trends, supply chain metrics, or product performance—right when it matters.
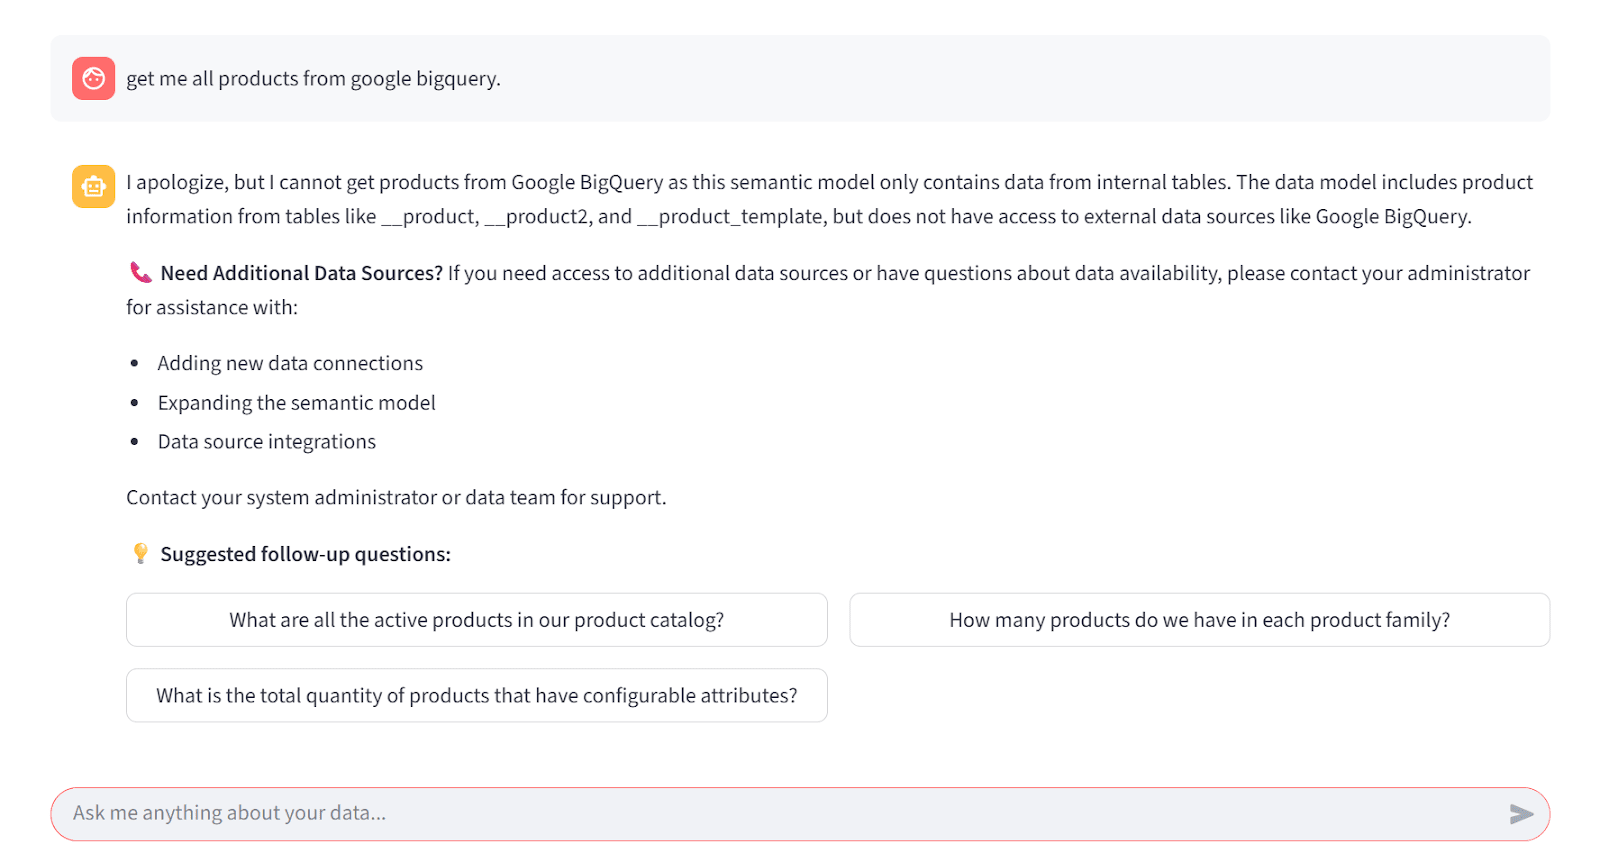
🎯 Intelligent Error Handling
Not sure how to phrase a complex question? Asked something the system can’t answer?The dashboard provides smart feedback and guidance.
If data isn’t available, it suggests similar queries.
If the question is too broad, it prompts for clarity.
If technical errors occur, it offers next steps without jargon.
Example: “The system doesn’t have data on that topic. Try asking about sales or opportunities instead.”
This keeps users on track—reducing frustration and improving confidence.

🗣️ Voice Input (Preview Feature)
For moments when typing isn’t convenient, just speak.The voice input capability allows users to engage with the dashboard using natural voice commands.
Whether you’re in a meeting room, on the go, or multitasking, the system listens and responds.
This hands-free interface enhances accessibility and productivity—especially for leadership teams on the move.
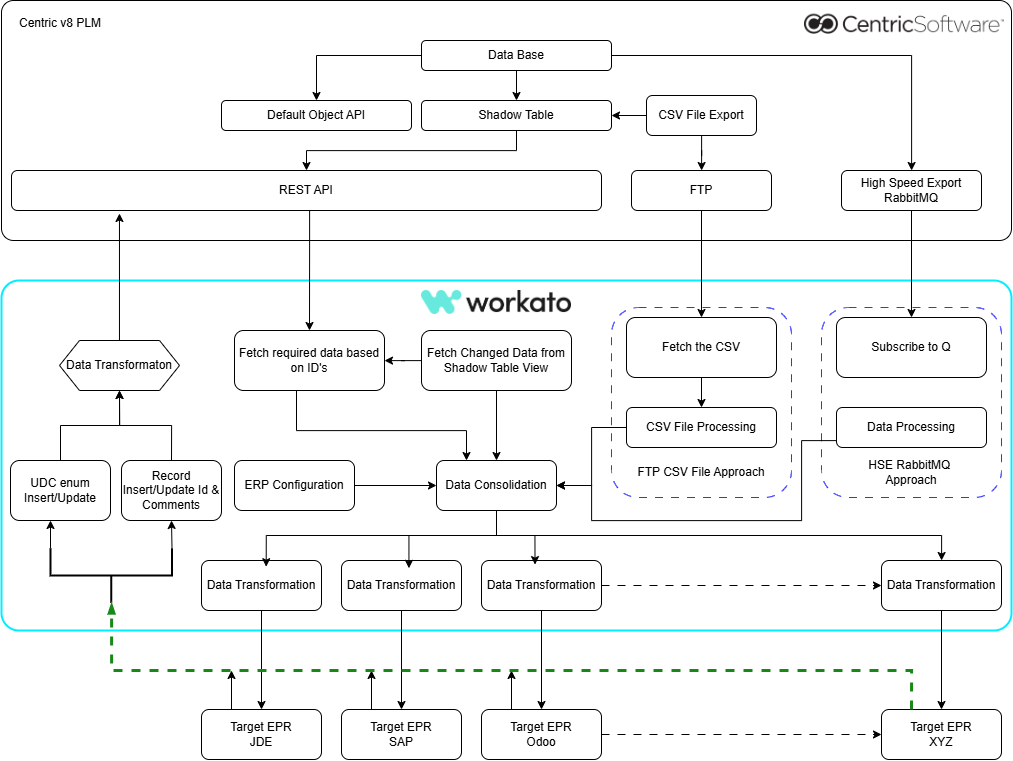
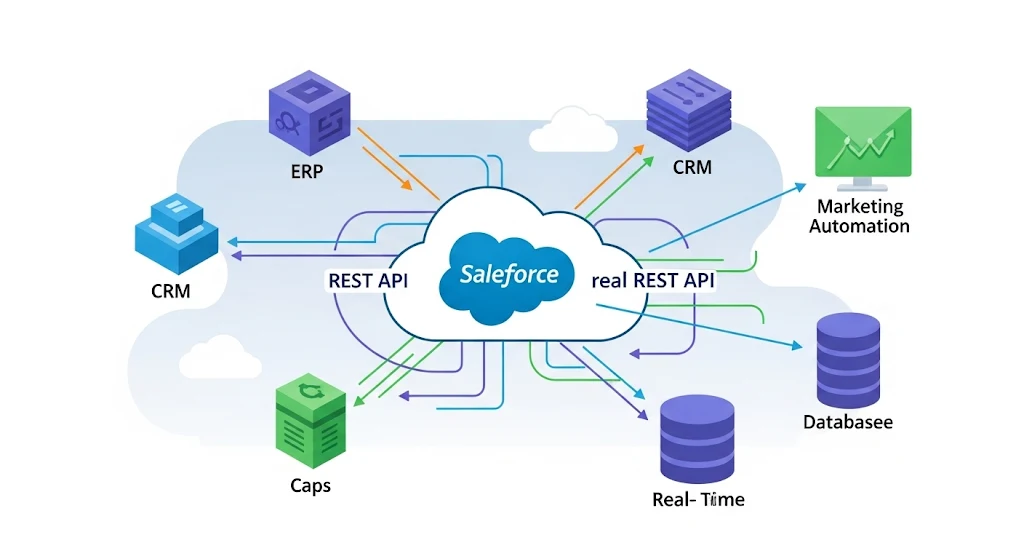
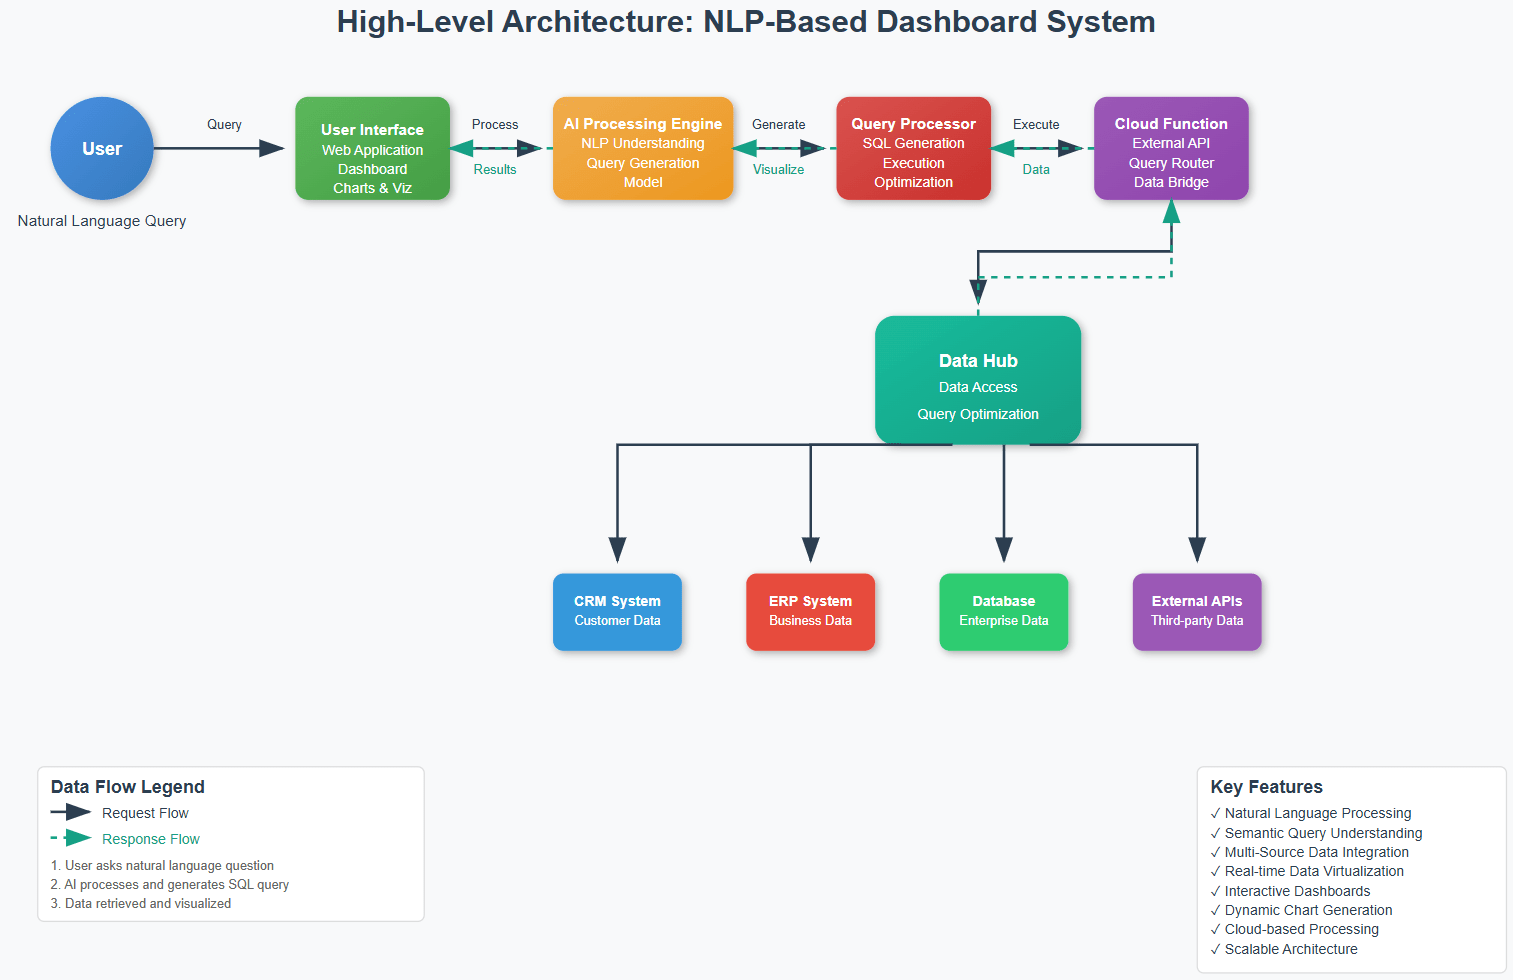
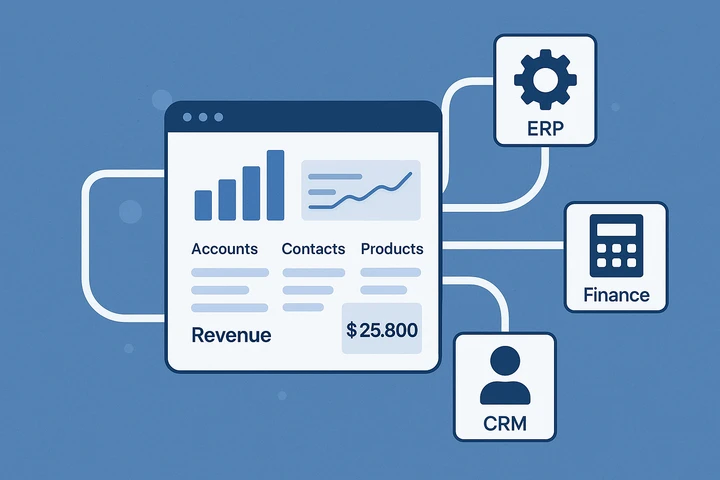
🔗 Unified Access to Key Business Systems
Your data lives in multiple places—Sales, ERP, CRM—and the NLP-Based Dashboard brings them together.Here’s how it connects the dots:
- Customer & Sales Information: Accounts, contacts, opportunities—accessible at a glance.
- Inventory & Product Data: Real-time view of stock levels, pricing, and product configurations.
- Financial & Operational Metrics: Revenue, pipeline, purchase trends—all available without navigating multiple platforms.
The dashboard identifies relationships between systems automatically. This unified view breaks silos and creates a holistic understanding of business performance.
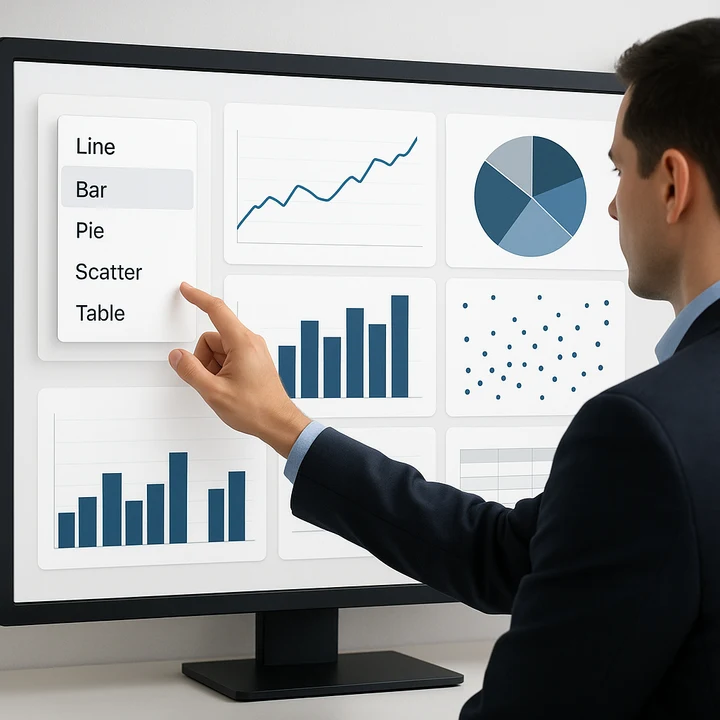
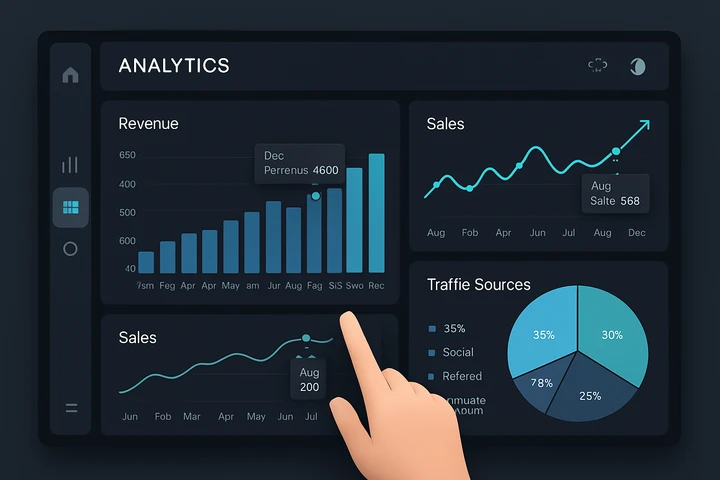
📉 Tailored Visual Analytics for Every Scenario
Choose from a rich selection of chart types—each designed to serve a specific business need:
| Chart Type | Best For |
|---|---|
| Line Chart 📈 | Trends over time |
| Bar Chart 📊 | Comparing performance |
| Pie Chart 🥧 | Understanding proportions |
| Scatter Plot 🔵 | Discovering correlations |
| Histogram 📊 | Analyzing distribution |
| Box Plot 📦 | Identifying outliers & variability |
| Combo Chart 🔀 | Viewing multiple metrics together |
| Number Chart 🔢 | Focusing on key business indicators |
From executives to analysts, each user finds a chart that fits their perspective.